


 |
Thirty Years After Chimbote, The Same Coastline Is Fuller On 21 February 1996, an offshore earthquake of magnitude 7.5 to 7.8 sent a tsunami into Chimbote Bay on the northern coast of Perú. It affected roughly 590 km of coastline, killed twelve people and produced run-up of about five metres [1]. Thirty years later the same coastline carries a far larger and denser population, and the arithmetic has not become gentler: people may have fifteen to thirty minutes to reach safety, and whether they make it depends on the road network around them [2]. Researchers have modelled this interaction for two decades. Agent-based models can simulate a whole city leaving at once, find the streets that jam, and test what a new access route would change. |
|
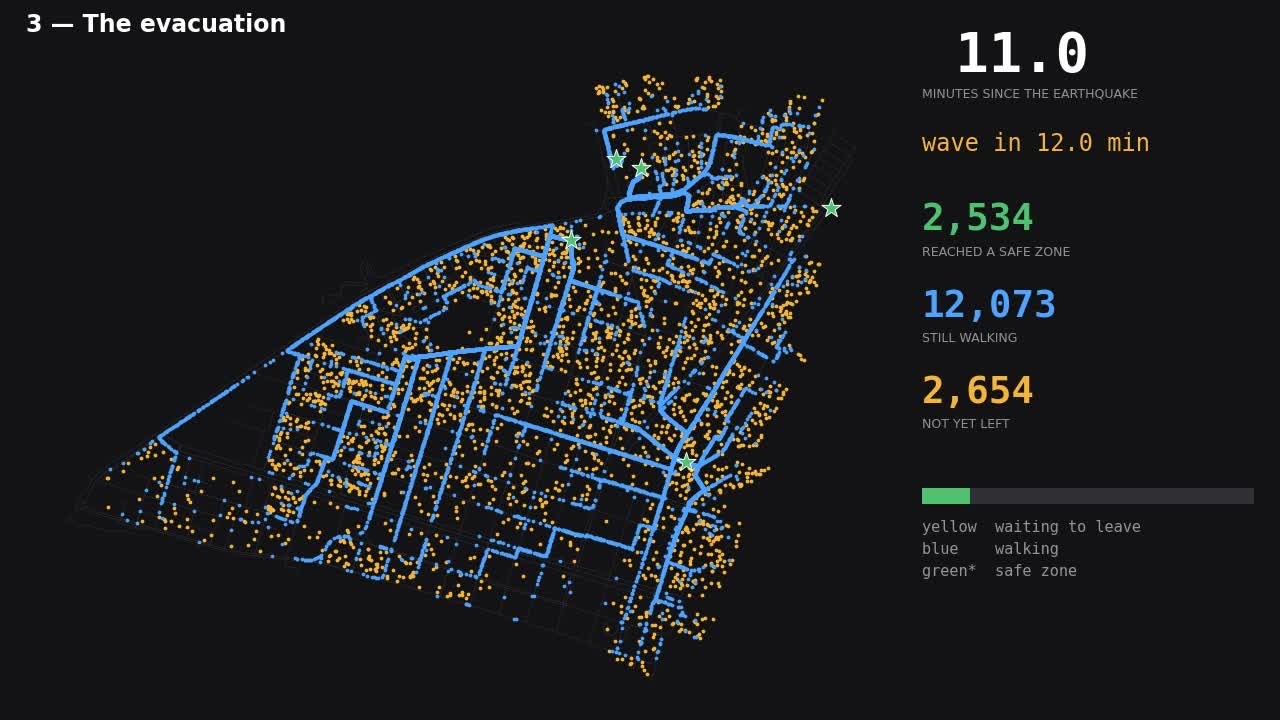
GTEM simulation of pedestrian evacuation in Chimbote, Peru Source: CDRI Fellowship Project 2411083052 (2025-26). |
|
What they have almost never done is reach the desk of the municipal officer responsible for the evacuation plan. Our CDRI fellowship project set out to close that gap and began by asking rather than building.
What Twenty-Four Coastal Governments Told Us
With ethics approval from Tohoku University and national dissemination through an official CENEPRED[1] circular, we surveyed disaster risk management officers of Perú’s coastal local and regional governments. Twenty-four valid responses came back, covering seven of the ten coastal departments, and the picture they describe is consistent and, we think, generalizable beyond Perú.
Awareness is not the problem. Most respondents reported medium-to-high knowledge of tsunami risk and hold an evacuation plan. Analytical capability is the problem: 87.5 percent had never used any simulation or evacuation model. Plans are built from drills, official hazard maps and accumulated local experience. Asked what they would want from a model, they put identifying evacuation routes and estimating total evacuation time at the top. Asked what stops them, they named population resistance, limited budget and technical resources, weak coordination, outdated geographic information and untrained staff.
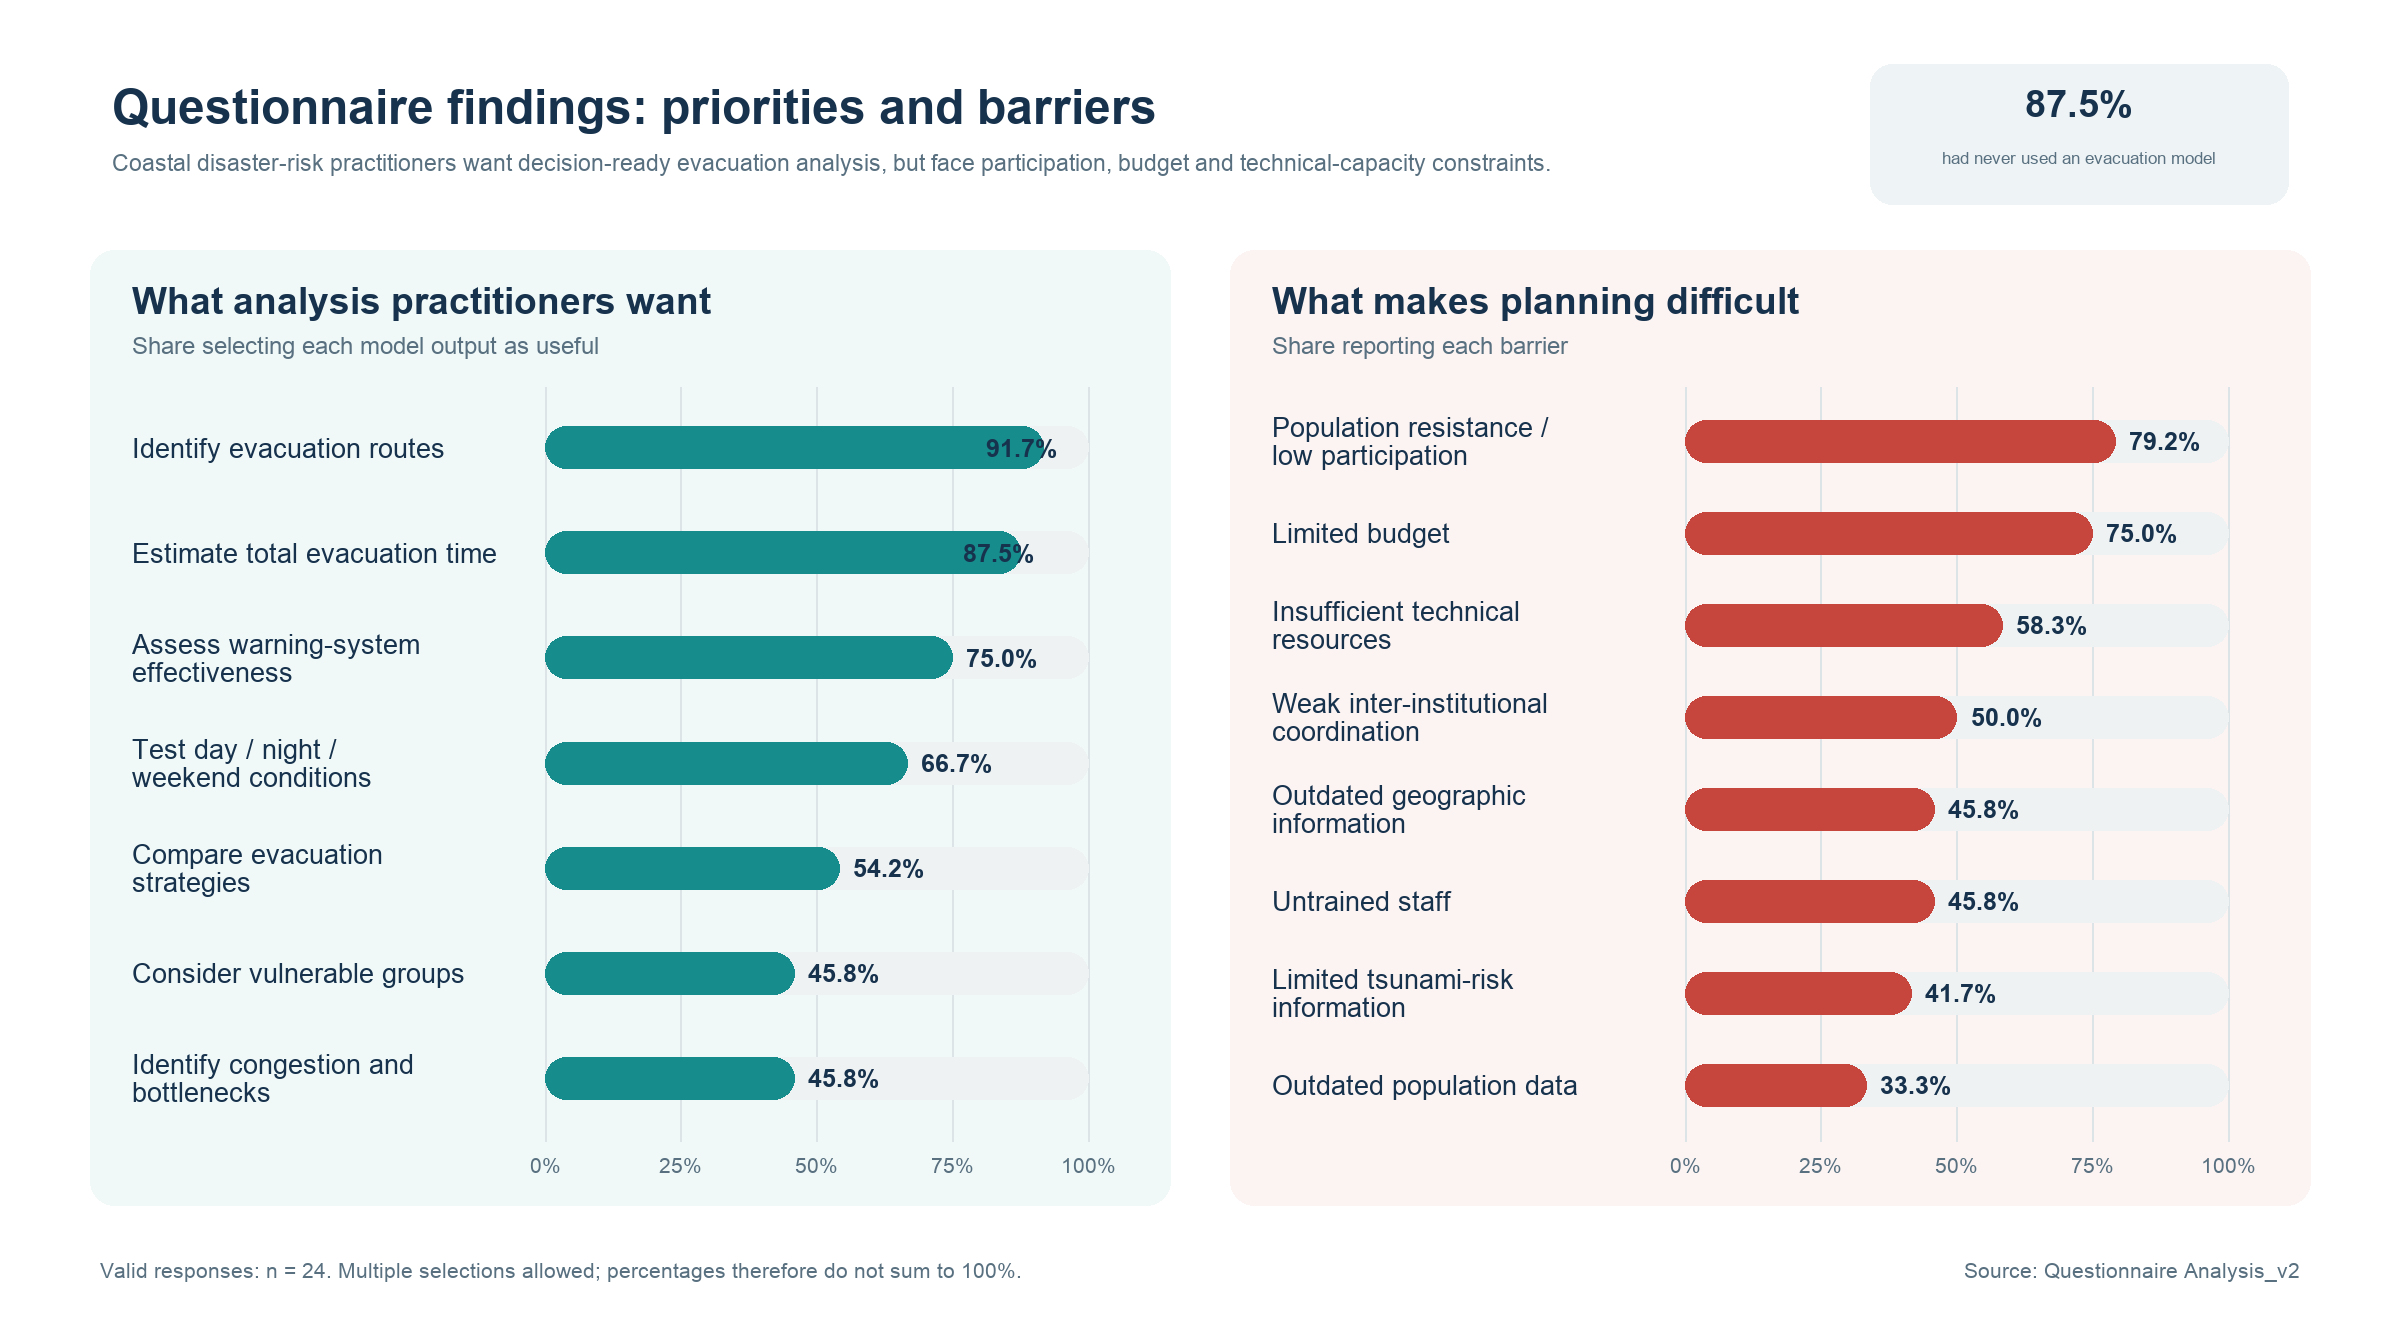
Figure 1. What coastal local governments in Perú want from an evacuation model, and what makes evacuation planning difficult. Valid responses: n = 24; multiple selections were allowed, so shares do not sum to 100 per cent.
Source: Authors’ stakeholder survey, CDRI Fellowship Project 2411083052 (2025-26).
One answer reframed the project. When ranking what matters most in defining an evacuation route, seventeen of twenty-four placed tsunami arrival time first — a variable nobody can change. The factors that can be changed, such as street width and condition or refuge capacity, ranked in the lower half. The demand for dynamic analysis is real, but it is latent: it shows up in what practitioners want, not yet in how they plan.
What Those Answers Changed In The Tool
The model we already had was a research instrument. Rebuilding it as GTEM — a Global Tsunami Evacuation Model — meant treating every stated need as a design requirement. Because few users open modelling software daily, GTEM runs from a single command with plain-text inputs and needs no contact with the source code. Because most lack GIS capacity, the inputs were cut to four shapefiles with a published schema, a QGIS walkthrough and a validator that reports what is missing before anything runs; preparing a new city is still hours of GIS work, and automating it is next. Because results must be defensible, every number is an average over multiple stochastic runs, and the tool reports how many runs are. Because words shape interpretation, "shelter" became "safe area" throughout: evacuation targets include any ground outside the inundation zone as well as vertical evacuation buildings.
One requested feature was reframed rather than delivered. Planners asked for "optimal routes". GTEM computes shortest paths, which is not the same thing, and the manual says so plainly. Being explicit about what a tool cannot answer turns out to build credibility rather than spend it. Future versions of GTEM aim to tackle this and other requests.
Evacuation Is an Infrastructure Question
In the Chimbote demonstration, at the modelled arrival time of twenty-three minutes, 82.4 percent of the exposed pedestrian population reached a safe area and the rest did not; the full population needs roughly forty minutes. That single number is not the useful output. The useful outputs are spatial: which blocks fail, which street segments carry sustained crowding rather than a brief spike, and which safe areas absorb the arrivals. In Chimbote the arrivals concentrate on a handful of destinations while one safe area attracts nobody, and nearly a fifth of road nodes cannot reach any safe area at all.
This is where evacuation planning becomes infrastructure planning. GTEM represents earthquake road damage not by deleting links — which stranded whole neighbourhoods unrealistically — but as a capacity-reduction weight, so a damaged street becomes less attractive, not impassable. That lets a municipality ask infrastructure questions directly: where a new access route would help most, where a new safe area is worth building, what a lost bridge does to evacuation times. Static inundation charts, which every Peruvian coastal government already uses, cannot answer those. They show where the water may reach, not whether people can leave in time.
The Harder Half of The Problem
We would rather be honest about what this project has and has not shown. It has produced a tool designed against evidence of practitioner need, verified against an independent implementation and an analytically known case, documented in Spanish and English, and released openly with worked case studies. It has not demonstrated that a municipal officer can install it, prepare their own data, read the outputs and act on them without us in the room. That is a different claim needing a different kind of evidence.
This distinction is the central preoccupation of planning support science, which has documented for two decades that technically sound instruments go unused for organizational rather than computational reasons: the tool fits no task the organization recognizes, nobody owns it, the skills leave when an individual leaves, and no budget line covers maintenance [3]. Every one of those appears in our survey data, in practitioners’ own words. So, we have written down five usability criteria — can an officer install and run it unaided, prepare the inputs, interpret the outputs, in how much time, and use the result to choose between two planning options — each with a measure and a pass condition. On 27 August 2026 we took them to practitioners for the first time: with the Colegio de Ingenieros del Perú in Ancash and officials of Chimbote and Nuevo Chimbote, who rated GTEM against all five after a full demonstration. Cost and installation were not the obstacle; interpreting the outputs was, unanimously.
What Comes Next
The hands-on session follows, with the same chapter and with participants who took no part in building the tool, our role limited to observing and logging where they get stuck. Beyond that: vehicles and mixed traffic, the most requested addition and the dominant source of real congestion; physically grounded damage scenarios; assisted evacuation; and validation against a real drill. Internationally, the route to scale runs through recognition programmes, and we are pursuing inclusion in IOC-UNESCO Tsunami Ready material.
The lesson of twelve months is not about tsunami science. The binding constraint on practical use is accessibility, documentation and institutional embedding — and treating those as first-class design requirements is what turns a research model into planning infrastructure.
[1] Bourgeois, J., Petroff, C., Yeh, H., Titov, V., Synolakis, C. E., Benson, B., Kuroiwa, J., Lander, J., & Norabuena, E. (1999). Geologic setting, field survey and modeling of the Chimbote, northern Perú, tsunami of 21 February 1996. Pure and Applied Geophysics, 154, 513-540.
[2] Perez, J., Moya, L., Ramirez, J., Gonzales, E., Mas, E., Adriano, B., & Koshimura, S. (2026). Tsunami evacuation planning for Camana, Peru: insights from agent-based modeling. Natural Hazards, 122(11), 488. https://doi.org/10.1007/s11069-026-08244-0
[3] Geertman, S., & Stillwell, J. (2020). Planning support science: Developments and challenges. Environment and Planning B: Urban Analytics and City Science, 47(8), 1326-1342. https://doi.org/10.1177/2399808320936277
By
Dr. Erick Mas, Associate Professor, International Research Institute of Disaster Science (IRIDeS), Tohoku University, Japan, Dr. Luis A. Moya Huallpa, Associate Professor, Engineering Department, Pontificia Universidad Católica del Perú (PUCP), Perú, Jheyder W. Pérez Aguinaga, Pontificia Universidad Católica del Perú (PUCP), Perú; now at Pontificia Universidad Católica de Chile (PUC), Chile
GTEM v1.0.0, its manual and the worked case studies are free and open source under the MIT license at https://regidirides.github.io/gtem/, and the release is archived at https://doi.org/10.5281/zenodo.22244754
This research was carried out under the Fellowship Programme of the Coalition for Disaster Resilient Infrastructure (CDRI), Project Code 2411083052. We thank CENEPRED, the Regional Government of Callao, the municipalities of Chimbote and Nuevo Chimbote, the Colegio de Ingenieros del Perú, IOC-UNESCO and the Peruvian Directorate of Hydrography and Navigation. The views expressed here are those of the authors and not necessarily the official views of CDRI.
